Demo library

Explore Qanitaei in motion

Six short AI-generated promos introduce the platform, chart tools, research overlays, Options Matrix, economics and brokerage workflows. Watch each clip here or download its MP4.

These are silent, six-second illustrative promos, not screen recordings or step-by-step tutorials. Interface details may differ from the app. Expand each topic list for feature guidance; opening the actual tools may require sign-in or a subscription. No orders are placed by these demos.

Trading desk with multiple glowing monitors in warm light

Overview · 6 seconds · Silent

Six ways to explore Qanitaei

A single introduction spanning Platform, Charts & indicators, Research overlays, Options Matrix, Economics & rates, and Dividends & brokerage. Then choose a category below.

AI-generated illustration, not a recording or tutorial of the app. Options Matrix data is EOD or dated snapshots.

Platform illustration

01 / Platform · 6 seconds · Silent

One workspace, connected research

A fast visual introduction to the platform’s research, planning, learning and account areas.

AI-generated illustration, not a recording of the app; depicted values and controls are illustrative.

Topics & where to find them
  • Research pages: Dashboard, Charts, Screener, Forecasts, Sentiment, Algo Trading, MoM Trends and Snapshots.
  • Planning pages: Portfolio, Dividends, Brokers, Alerts, Journal and Watchlists.
  • Economic research: Economic Calendar, Macro Calendar, indicator details, release history and Economic Analyst.
  • Learning and account areas: Learn, Profile, Pricing, About, Q&A and user activity; login, registration and password recovery support account access.
  • Data utilities: Data Connectivity and Data Refresh; administrators also have Reports, System Logs and Notification Settings. This six-second montage is not a page-by-page tutorial.
Charts & indicators illustration

02 / Charts & indicators · 6 seconds · Silent

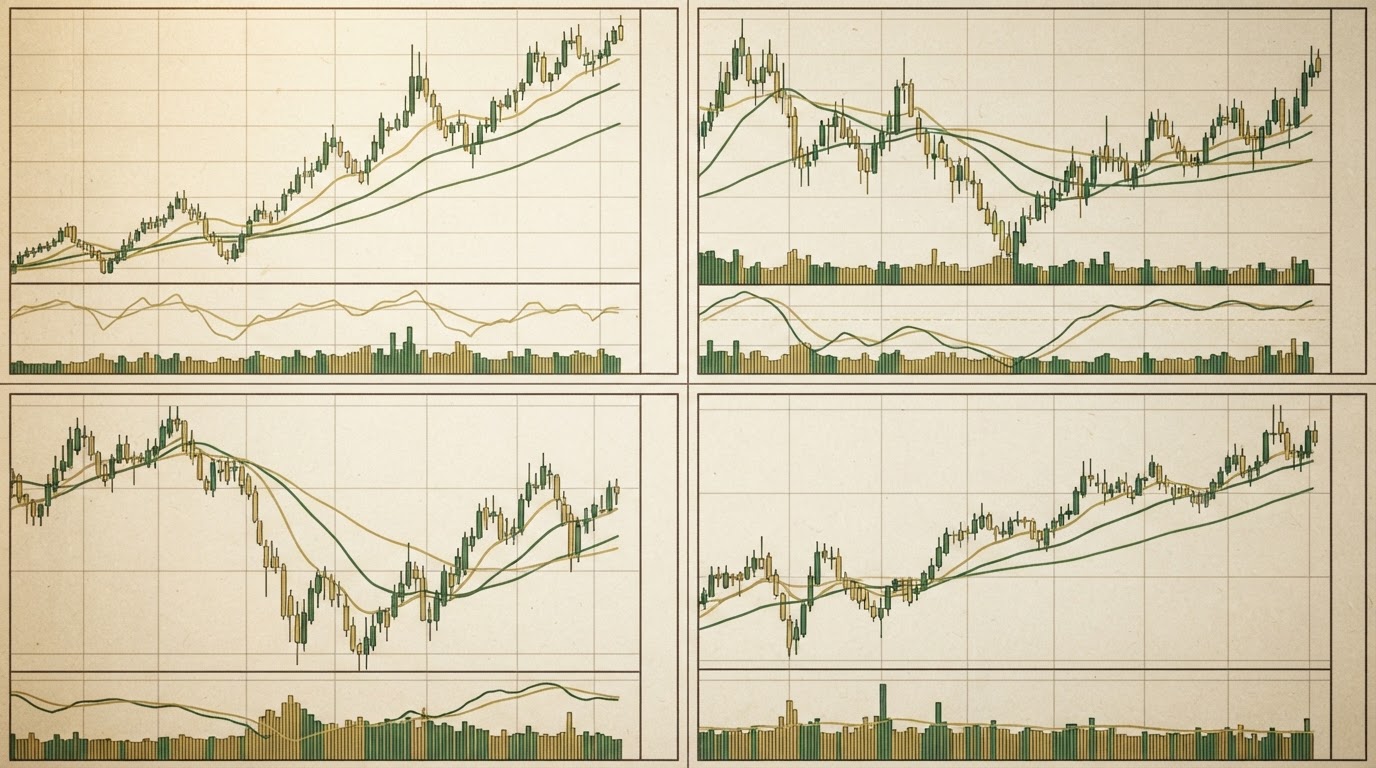
Expand the chart workspace

A multi-chart layout and expanding tools drawer introduce the charting workspace and technical studies.

AI-generated illustration, not a recording of the app; depicted values and controls are illustrative.

Topics & where to find them
  • Chart layouts: Single, Dual, Quad and Hex; choose a ticker, timeframe and chart type, then compare panels.
  • Right-click the chart to open Chart Scale, Tools, Drawings, Overlays, Trading and Multi Panel; expand groups to see their available controls.
  • Indicators: Overlay, Trend / Momentum, Volatility, Volume and Patterns. Presets include Trend + Momentum, Volume Confirmation, Scalper Setup and Swing Trader.
  • Technical tools include moving averages, RSI, MACD, Bollinger Bands, ATR, VWAP and pattern studies; use the indicator panel to select studies.
  • Analysis panels include Technical Analysis & AI, Fundamentals, Forecasts, Script Engine, Gamma Squeeze, Short Squeeze, BUY or SELL, Insider Trading, Earnings, Market News and Auto Alerts.
  • Utility panels include Profit Calculator, Options Calculator, Dividend Calculator and Export Data. Feature access depends on the signed-in account.
Open Charts
Research overlays illustration

03 / Research overlays · 6 seconds · Silent

Macro, GPVC and quantitative context

A conceptual chart brings together regime research, quantitative context and market-structure overlays.

AI-generated illustration, not a recording of the app; depicted values and controls are illustrative.

Research overlays are observations and model outputs, not guaranteed trading signals. Source availability and dates vary.

Topics & where to find them
  • Macro: compare economic context with the price chart; Events: inspect economic and earnings markers and their dates.
  • GPVC: explore gamma, put/call, volatility and macro context using the available overlay selections and definitions.
  • GPVC Enhanced: examine the enhanced pipeline and its available datasets; keep extraction dates in view.
  • Quant: open the Quantitative panel for available research datasets and chart comparisons.
  • Futures: switch to supported futures instruments and their available timeframes.
  • P/C Ratio: compare dated put/call history. Volume Profile: inspect volume by price and concentration zones.
Open chart tools
Options Matrix illustration

04 / Options Matrix · 6 seconds · Silent

From chain to options analytics

An options-chain concept expands into exposure, open-interest and implied-volatility research.

AI-generated illustration, not a recording of the app; depicted values and controls are illustrative.

Options Matrix uses EOD (End of Day) or dated snapshots, not real-time or executable quotes. Illustrative prices in this promo are not market observations.

Topics & where to find them
  • Options Matrix views: Chain, History, All-Expiry OI and EOD Spread.
  • Choose expiry categories and dates, toggle OI, volume, bid, ask, last, Greeks and IV columns, then adjust the strike range.
  • Show Charts opens gamma exposure and open-interest views, with cross-expiry DEX/GEX and put/call comparisons.
  • Related tools include IV Surface 3D, MA Exposure, MBO/Microstructure, Options Calculator and contract risk scenarios.

05 / Economics & rates · 6 seconds · Silent

Economic data, events and the calendar

Historical economic charts connect to release calendars and yield comparisons in a compact visual preview.

AI-generated illustration, not a recording of the app; depicted values and controls are illustrative.

Topics & where to find them
  • Dashboard: explore inflation, employment, growth and other economic categories; open indicators for historical context.
  • Charts → Econ: select available economic series and compare their historical paths.
  • Economic Calendar: review release dates and available actual, forecast and prior values; distinguish release time from data observation date.
  • Macro Calendar and Release History provide additional event and historical-release views.
  • Rates: compare Treasury yields, Treasury vs Equity and available global rates/FX series. Economic releases have different publication frequencies.

06 / Dividends & brokerage · 6 seconds · Silent

Income planning to brokerage order review

Dividend projections lead into a conceptual brokerage connection, account selection and order-review flow.

AI-generated illustration, not a recording of the app; depicted values and controls are illustrative.

Illustrative workflow only: no brokerage is connected and no order is placed by watching this video. Projections are hypothetical, not guaranteed returns; account permissions and supported order types vary.

Topics & where to find them
  • Dividends: maintain income-focused holdings and compare cash, custom reinvestment and full reinvestment projections.
  • Charts also contains a Dividend Calculator alongside the other calculation tools.
  • Brokers: connect a supported brokerage, select an account and inspect available balances and positions.
  • Order flow: select the instrument and order details, review them carefully, then explicitly confirm in the actual brokerage workflow. This promo stops at review.
  • Portfolio, Alerts and Journal support position tracking, threshold monitoring and trade reflection.

For educational and informational purposes, not investment advice. Options Matrix data is EOD (End of Day) or dated snapshots, not real-time or executable quotes.